

Shaping our thinking... on how we all embed data led decision making.
Sharing our learning... on our process for achieving this.
Alex Wilde, Dunoon Project Lead in the Shaping Places for Wellbeing Programme, shares her key reflections for local action on our journey to support data-informed decision-making about our places. More information about the programme is at the end of this blog.
One of the overarching ambitions of the Shaping Places for Wellbeing Programme is reducing inequality through a place-based approach. Given this ambition, we had already chosen to work locally in towns that featured in the top 20% of the Scottish Index of Multiple Deprivation. To support a clear focus on what the inequalities are specific to each project town, we wanted to understand:
- The extent of inequalities experienced in the town
- What groups within the community are being impacted most
- Where these groups live
We set out to use quantitative data as a starting point in a journey to understand the perspectives of the groups impacted by inequality and what they need from their place. Our intention is that the information will then be used to support partners when making decisions that impact a place. We also wanted to develop a consistent approach that could be replicated in other towns.
In this blog, I’m sharing my thoughts on achieving the above and the value of the learning journey it took us on. This will include:
- Our approach to gathering data to inform the key inequalities for each Project Town and how we collected and analysed it
- Examples of our findings from the different towns, and crucially
- What we learnt from the process - what surprised us, what were the limitations and what we identified as common and different barriers, considerations and opportunities.
It is important at this point to say I’m focusing on the collection and analysis of quantitative data. As the programme progresses, we will use this as a foundation to combine with other sources of data including qualitative reports on stakeholder engagement to build a broader picture. This will be shared in a separate blog.
What did we do?
The Shaping Places for Wellbeing Programme is working in seven Project Towns across Scotland. Our approach across all of these was to start with publicly available quantitative data for each town settlement and see what direction this pointed us in. This wasn’t to place a greater value on quantitative over qualitative as a source of data but to give us a starting point that is available across Scotland for others to use. Our partners at Public Health Scotland provided a resource of the Local Intelligence System Team (LIST) to support the extraction and analysis of data to see what stood out for each town. Given the intention was also to be able to share the process so that it could be replicated in other areas, using public data sources was important.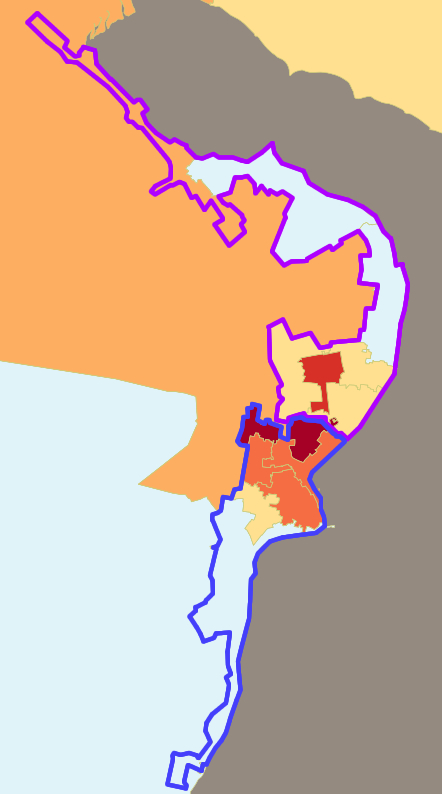
The Project Town Data Profiles being produced for each town began by identifying trends which stand out in comparison to the wider local authority and Scotland averages. They also identify inequalities between different areas within the town. For the reader with data expertise, I can confirm that the data is primarily drawn from an intermediate zone level, of which there are between two and nine covering our Project Towns. We found however that this doesn’t always fit neatly with electoral and administrative boundaries or what people perceive as the borders of their town settlement. In these circumstances, we applied common sense in our choice of what intermediate zones to include and have clearly explained this caveat within the Profile.
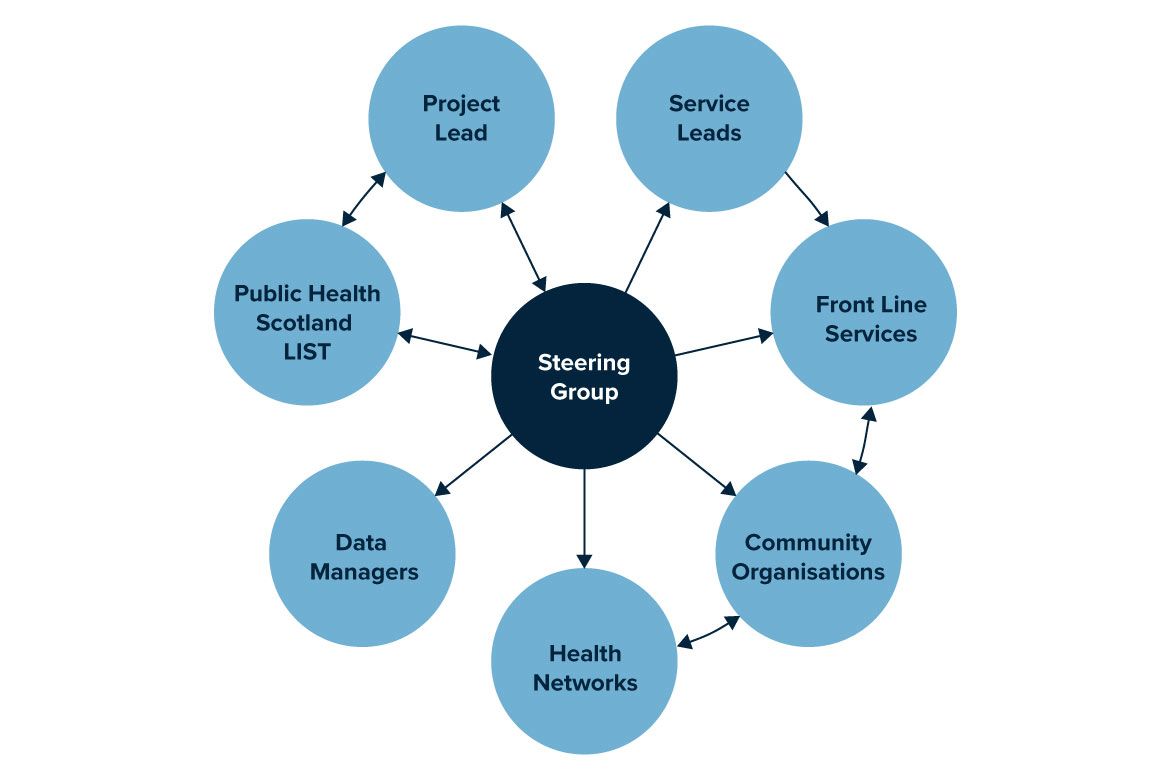
The insight and knowledge of our steering groups was crucial in the next steps of sense-checking the data, identifying potential gaps and highlighting other data sources that could add insight on the population groups being impacted. We also broadened our investigations out to include wider stakeholders such as health service leads, community planning partners, health networks and third-sector organisations. This journey has been different in each town as it requires a process of discovery.
(Image shows example of Dunoon settlement which includes the communities stretching from Bullwood to Sandbank. The intermediate zone called Dunoon outlined in blue.)
One of the main inputs for this programme is time and expertise, and I’ve experienced a huge generosity in people giving their time to share knowledge. This has highlighted gaps, raised questions and added weight to emerging priority areas. It has also prompted me to critically reflect on the nature of data, how we use it, value it and share it.
The end result is a Project Town Data Profile that gives previously unknown insight into:
- The extent of inequalities experienced in the town
- What groups within the community that are being impacted most
- Where these groups live
In our Project Town of Ayr, this Data Profile has been described as “probably one of the best data sets that I’ve ever seen”. Coming from the Health Improvement Manager that sits on the Ayr Steering Group, it’s a statement we are all very proud of!
With the Data Profiles providing a deeper dive into local data across our Project Towns, we wanted to find a way to help the key messages from them continue to resonate with all our stakeholders. To do this we’ve also produced an infographic for each complete Profile. They provide an accessible and memorable summary of the key insights from the data and a valuable resource for decision-makers.
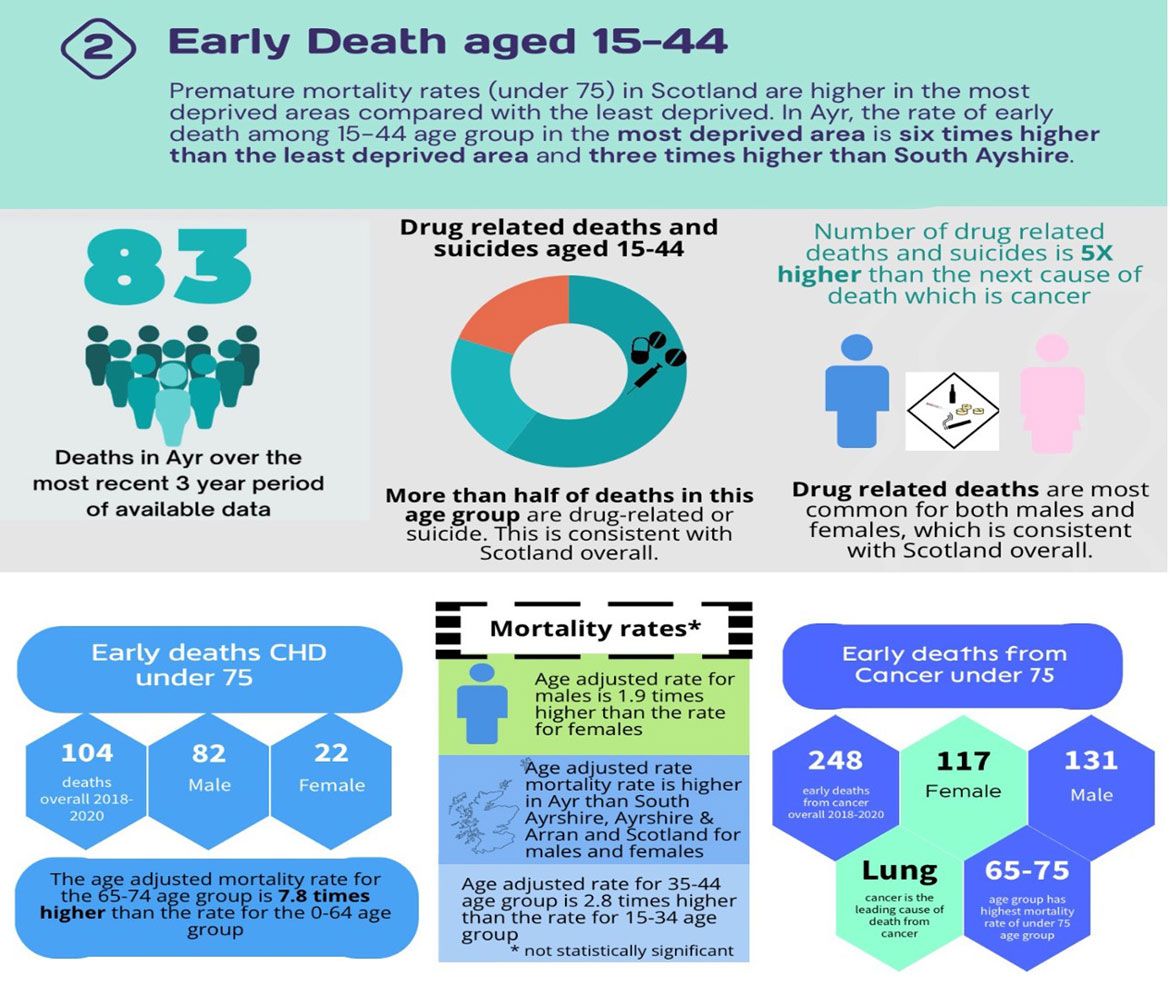
In Ayr, the rate of death among the 15-44 age group in the most deprived area is six times higher than in the least deprived area, and three times higher than South Ayrshire.
- There were 83 deaths in Ayr over the most recent 3 year period of available data
- More than half of deaths in the 15-44 age group are drug-related or suicide.
- The number of drug-related deaths or suicides is five times higher than the next cause of death (cancer).
- There were 104 early CHD deaths under 75 in 2018-2020. 82 were male, 22 were female.
- The age adjusted mortality rate for the 65-74 age group is 7.8 times higher than the rate for the 0-64 age group.
- The age adjusted mortality rate for males is 1.9 times higher than for females.
- The age adjusted mortality rate is higher in Ayr than in South Ayrshire, Ayrshire and Arran and Scotland for males and females.
- The age adjusted rate for 35-44 age group is 2.8 times higher than the rate for the 15-24 age group.
- There were 248 early deaths from cancer (under 75) in 2018-2020. 117 were female and 131 were male.
- Lung cancer is the leading cause of death from cancer.
- The 65-75 age group has the highest mortality rate of those under 75.
What have we learned
We’ve all been on a steep learning curve to find a shared process and language that ensures clarity in what we are finding out and maximises consistency in how we have achieved it. This has included how it is spatially defined and what the caveats are on what data has been found. Some of the key challenges we have experienced are:
- Identification of inequality issues through stakeholder engagement but being unable to access data which could qualify that. The limited amount of publicly available data on mental health is an example of this.
- The most easily accessible data was for intermediate zones, which doesn’t always fit well with the boundaries you want work with.
- Statistical disclosure means the number of people the data refers to may be so small that it is possible to identify individuals, and thus this valuable local information cannot be shared with all those making decisions in a place.
- Measures of inequality available through public data sources draw on data such as deaths, hospitalisations and benefit claims. Data from doctors in general practice is not available as standard.
- The most recently available census data is still 2011.
What the data is telling us so far
Within the seven Project Towns, we have fully completed two Data Profiles with a further five at different points on the journey to completion. To date, the key areas of inequality emerging from the quantitative data are similar across the Project Towns. Given they were selected because of their areas of deprivation, it is not surprising that there might be common inequalities. These are:
- People experiencing addictions
- People living in poverty
- Early deaths in the age group 15-44
In each of these groups it is the communities living within the geographic areas of deprivation that are being impacted most.
While the themes are perhaps not unexpected, the statistics can be really stark. For example:
- Asthma hospitalisations, for Alloa South and East and Dunoon are more than double the Scottish and local authority averages.
- Alcohol hospitalisation admissions for Dunoon are 1.6 times higher and for Ayr North are 4.5 times higher than the local authority average
- 40% of the population of Ayr North are claiming out-of-work benefits compared to the average of 16% across Scotland
In terms of inequalities within the towns, the comparative difference between areas is often very striking. For example, life expectancy in Ayr shows a difference of 14 years depending on whether you live in north or south Ayr. Alcohol admissions in some parts of Ayr are almost ten times those in other parts.
This quantitative data has given us an important part of the picture of inequalities in the towns. It has provided clear indications of the extent of the challenges brought about by inequality and provided a focus for investigating the demographics most impacted. Also given it is publicly accessible data, gathered on a regular basis, it also includes measures which can be compared against in the future.
Going forward there are some reflections on the data journey so far which are important to keep in mind:
- Data doesn’t tell us about a person’s lived experience of a place or their journey through different services and support. However, it does give us a crucial guide on whose experience we need to take account of to inform decision-making.
- To take an assets-based approach it is important to be aware of the potential for the data to lead us into focusing on the negative aspects of place.
- New quantitative data will become available over the lifetime of the project which will inform the ongoing sense checking of each area of focus.
What next?
All our learning highlights the importance of having both quantitative and qualitative data sources to build a picture of inequalities in our Project Towns. The next steps will be the work undertaken by the Community Link Leads to both sense check and bring to life the quantitative data by connecting into the knowledge, experience and insight of community organisations in our Project Towns. This will also assist in filling gaps, for example on mental health, where quantitative data wasn’t able to identify which demographics are affected by inequalities.
In order to support partners when making decisions that impact a place, we have been using the data to feed into our Place and Wellbeing Assessments. These assessments are providing a structured way to support decision-makers' awareness of their impact on place and its subsequent impact on the wellbeing of people and planet. The data provides a crucial perspective on those demographics who have the most to gain from a reduction of inequality in the decision-making process.
For more information on our Place and Wellbeing Assessments and their role in informing decision-making about a specific plan or proposal, look out for the next blog in the series.
As part of the Shaping Places for Wellbeing Programme we aim to evaluate our work and share our learning across different key stages of the programme. One way we will share this is through the ‘Shaping our thinking, sharing our learning’ blog series.
Some key information about the programme:
- We are working to improve Scotland’s wellbeing by reducing the significant inequality in the health of its people while addressing the health of our planet.
- The action is anchored in the Place and Wellbeing Outcomes.
- It is a joint programme between the Improvement Service and Public Health Scotland working in local partnership with local authorities and local health boards.
- We have three key activities to support local activity:
- Local Project Towns support in Ayr, Alloa, Clydebank, Dunoon, Fraserburgh, Rutherglen and Dalkeith.
- Local Learning Cohort
- National Leadership Cohort
- It runs until March 2024.
If you are looking at place-based approaches, or if the Shaping Places for Wellbeing Programme sounds like something you would like to know more about, please contact Irene Beautyman, Place and Wellbeing Partnership Lead, below or follow us on X (Twitter) @place4wellbeing to keep up to date with all of our latest news
Irene Beautyman - Place and Wellbeing Partnership Lead
Phone: 07908 930763
-
Shaping Places for Wellbeing Programme
The Shaping Places for Wellbeing Programme is a joint delivery partnership between the Improvement Service and Public Health Scotland. This forum is for those interested in our work supporting the role of place to reduce inequality and improve the wellbeing of people and planet.
-
Place Network
For those interested in the importance of place as a working approach to delivering national outcomes around improved wellbeing and inclusive growth.