products
Data Visualisation Tool
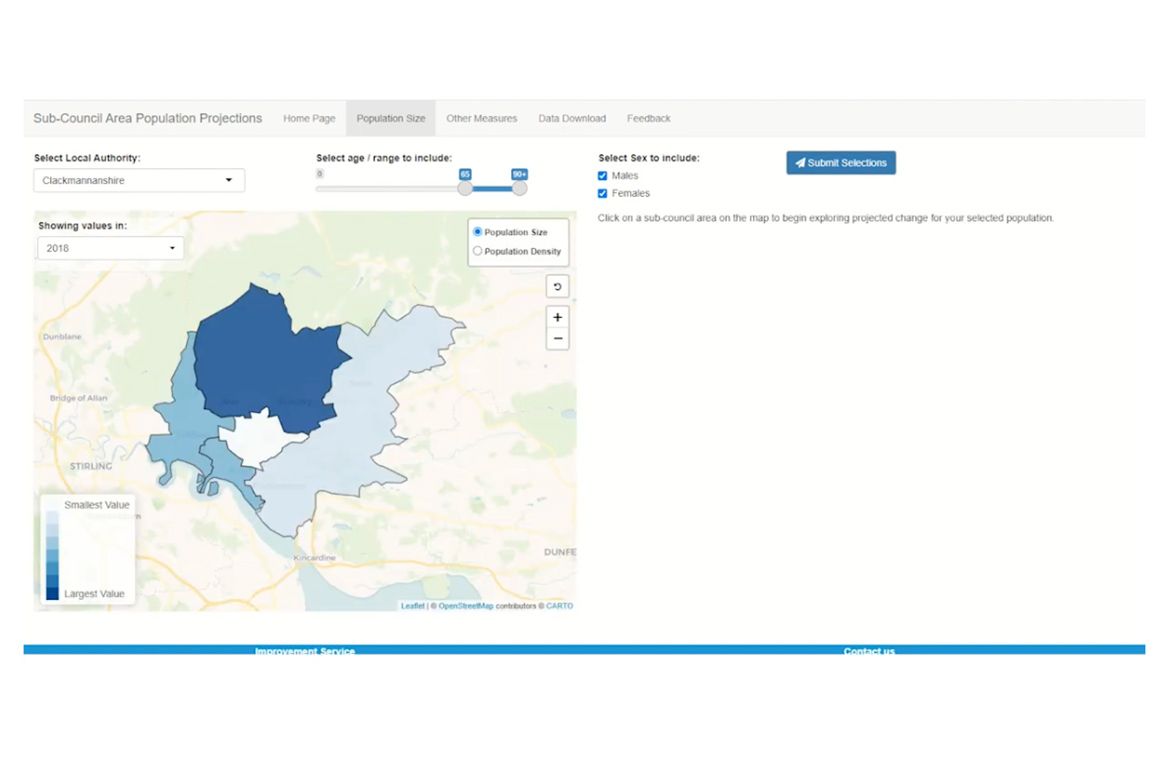
An interactive visualisation has been produced which allows users to explore the set of sub-council area population projections.
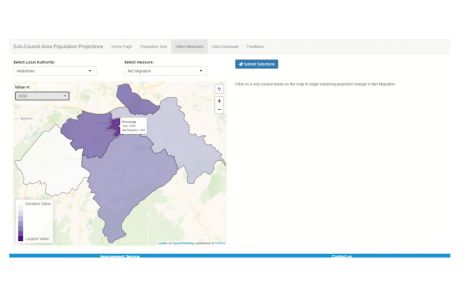
The tool uses maps, graphs and data downloads to allow users to more readily analyse the current set of published sub-council area population projections. Users can create bespoke selections to help asks questions such as:
- Within my council area, where is projected to have the fastest growth in population?
- Within my council area, where is projected to have the largest elderly population?
- How is net migration projected to contribute to the change in population within my council?
These insights can support a wide range of local-level decision-making and planning including housing need, healthcare planning and demand assessment.
Visit the data visualisation tool
Sub-council area population projections visualisation tool
Take a look what you can do within the visualisation tool.


