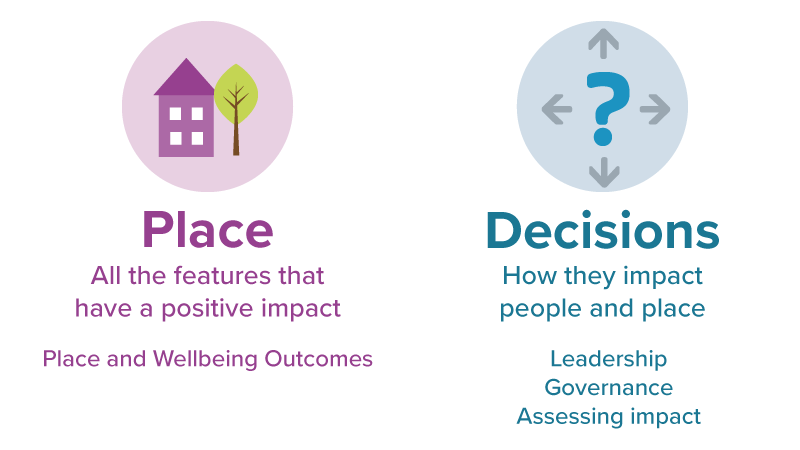
 A focus on inequality is central to the Shaping Places for Wellbeing place-based approach. In order to understand what is needed to reduce inequality and improve wellbeing in a place, it is necessary to know what people in an area are experiencing. We use a range of data to do this, and then bring it into decision-making processes.
Our approach to data collection, analysis and sharing, which we followed in the seven Project Towns in 2022-2024, involved these key stages in our data journey:
- Producing a profile of quantitative data for the town with support from Public Health Scotland.
- Sense checking this profile with stakeholders and agreeing on a set of key inequalities.
- Gathering and analysing qualitative data, using the key areas of inequality as a starting point with the support of Community Link Leads.
- Producing outputs to communicate findings from both quantitative and qualitative data. Share with stakeholders and use to support decision-making.
An important aspect of our approach was the use of qualitative data alongside the quantitative data. The combination of these data types provides a richer, more complete picture of what people in an area are experiencing. Read a summary of the process on the data journey page and find out more detail in our How-To Guides.
A data profile was produced for each Project Town produced compromising four documents which are explained below.
Project Town Data Profiles - Local Project Action 2022-2024
What we set out to do
Our whole systems approach means we used a broad range of data including health, economy and environment to understand how people are impacted by inequality and what they need from their place.
The Programme aimed to increase the value of understanding local Project Town inequalities when making decisions and consideration of the unintended impacts of plans and proposals on place and those who use it to support system change.
What we developed
To bring our approach and its resulting outputs to life, you can see examples from each of our Project Towns. Each Project Town produced four documents:
- Quantitative data profile
- Quantitative data infographic, highlighting key areas of inequality
- Community Link Lead report
- Visual summary of key insight from the report
These documents are available on the Local Project Action pages for the seven Project Towns.
The approach of the Programme to supporting data-led decision-making was developed through testing and learning in the Project Towns through Local Project Action. We captured our learning through blog posts and produced two ‘How-To Guides’ for capturing and analysing data.
 You can learn more about the Place and Decisions elements of the Shaping Places for Wellbeing place-based approach.
Based on our Local Project Action experience, we believe people having certain experiences, behaviours, attitudes, values and motivations when engaged in our data journey activities helps to enable system change. We referred to these as the “mechanisms of change”.
If the Shaping Places for Wellbeing place-based approach sounds like something you would like to know more about, please contact Irene Beautyman, Place and Wellbeing Partnership Lead, below. Alternatively, follow us on LinkedIn - Planning and Place-Based Approaches, to keep up to date with the Planning and Place-Based Programmes from within the Improvement Service, and X @place4wellbeing to recap on the Shaping Places for Wellbeing Programme’s journey

Irene Beautyman - Place and Wellbeing Partnership Lead
Phone: 07908 930763
-
Planning for Place Programme
The Planning for Place Programme supports councils and their partners to collaborate around place, seeking to encourage place-based approaches to joint planning, resourcing and delivery of places that enable all communities to flourish.
-
National Planning Improvement Programme
The National Planning Improvement Champion is responsible for monitoring the performance of planning authorities and providing advice to them (and others) on what steps might be taken to improve their performance.
-
Planning Skills
The Planning Skills Programme co-ordinates training events for public sector planning officers, with the aim to develop the skills required to deliver better places.
-
Digital Planning
The Digital Planning team at the Improvement Service collaborates with local government to enhance and unify data related to planning and building standards. This work aims to develop a cohesive national data landscape, fostering insights and supporting informed decision-making.
-
Shaping Places for Wellbeing Place-based Approach
The Shaping Places for Wellbeing Programme is a joint delivery partnership between the Improvement Service and Public Health Scotland. This forum is for those interested in our work supporting the role of place to reduce inequality and improve the wellbeing of people and planet.
-
Place Network
For those interested in the importance of place as a working approach to delivering national outcomes around improved wellbeing and inclusive growth.